Author
Akul Y. Mehta & Richard D. Cummings
Description
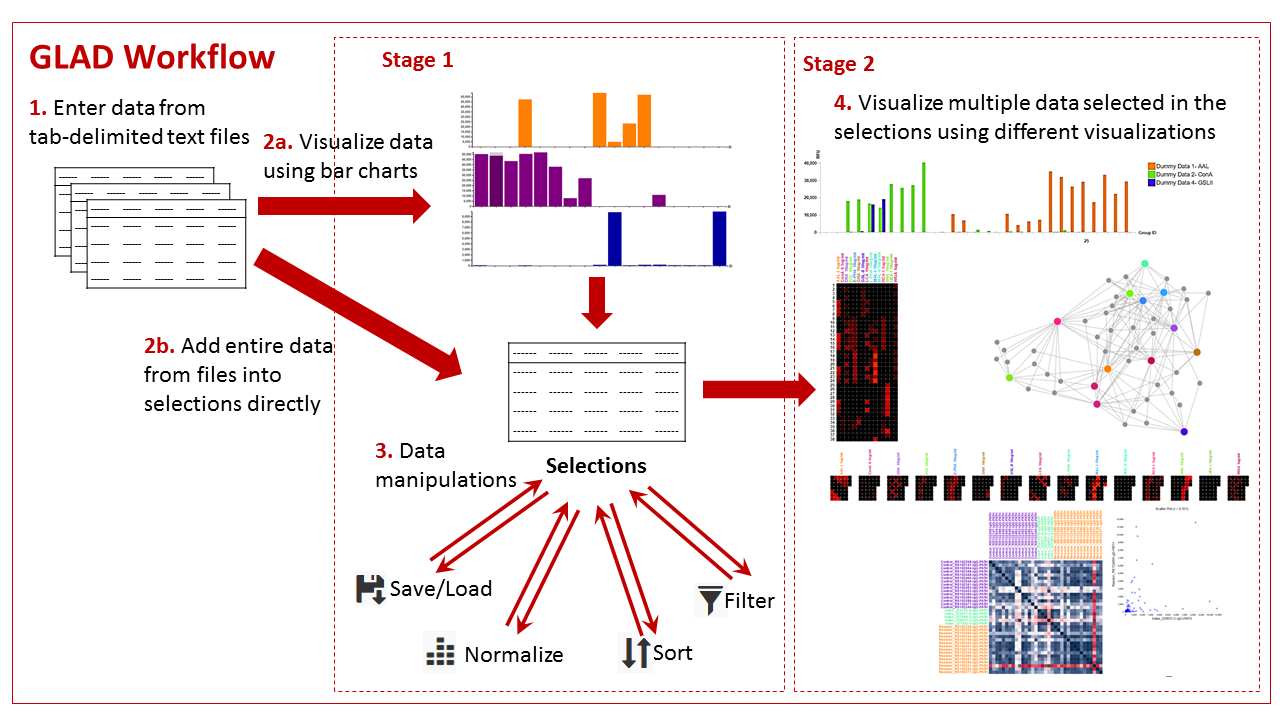
GLAD (Glycan Array Dashboard) is a tool to visualize, analyze and compare glycan microarray data. It is built using popular JavaScript libraries D3.js, Lodash, jQuery, Bootstrap, jStat and Select2.js.
In the stage 1 GLAD offers users the ability to view their data as bar graphs and compare different data in the form of bar graphs. The users can then select data from multiple samples for stage 2, where they can then compare data using multiplex tools such as grouped bar graphs, heatmaps, calendar heatmaps and force directed graphs and correlation maps. Such selected data can be stored on the users computer and loaded back into the tool at the user’s convenience and can be manipulated to mine information and visualize patterns in it. The users can also view structures for the glycans which are generated instantaneously.
Tool Page (Latest Version)
v3.1 | glycotoolkit.com/Tools/GLAD/
(Note – You can read about the changes in the change log below. The documentation may not reflect the latest version of the application. Please contact us if you need help.)
Please Cite…
If you use GLAD please cite our paper: https://doi.org/10.1093/bioinformatics/btz075
Documentation
glycotoolkit.com/GLAD/documentation/
Changelog
glycotoolkit.com/GLAD/documentation/changelog/
License

GLAD (Glycomics Array Dashboard) by Akul Y. Mehta, Richard D. Cummings is licensed under a Creative Commons Attribution 4.0 International License.
Based on a work at glycotoolkit.com/GLAD.